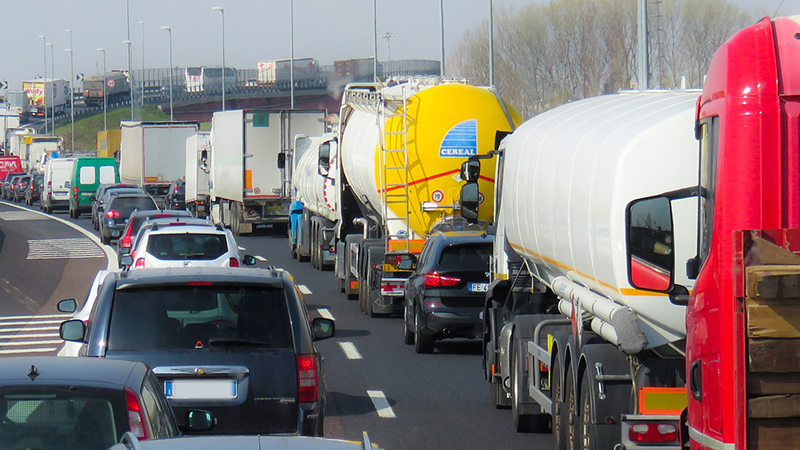
With average driving speeds falling in some of the UK’s major cities, nightmare commutes could soon become a daily occurrence. Find out if yours could be one of them…

Is this what’s waiting for you on your commute?
2023 research by tomtom found that London had the lowest average speeds not only in the UK but in the world with an average travel time distance of 10km taking more than 37 minutes, a further increase from 2022.
Travel Time Statistics
This report summarizes travel time data for various cities in the United Kingdom.
Average Travel Time: The average travel time per 10 km is 20 minutes and 53 seconds.
Congestion Level: The average congestion level across the cities is 36%.
Time Lost in Rush Hour: On average, commuters lose 3 days and 1 hour and 22 minutes per year due to rush hour traffic.
Average Speed in Rush Hour: The average speed during rush hour is 25 km/h.
Travel Time by City
The city with the fastest average travel time is Preston at 17 minutes and 20 seconds per 10 km. London has the slowest average travel time at 37 minutes and 20 seconds per 10 km.
Congestion Levels
The city with the highest congestion level is London at 45%. The city with the lowest congestion level is Preston at 31%.
Time Lost in Rush Hour
The city where commuters lose the most time in rush hour is London at 148 hours per year. The city where commuters lose the least time in rush hour is Leeds-Bradford at 56 hours per year.
Average Speed in Rush Hour
The city with the slowest average speed in rush hour is London at 14 km/h. The city with the fastest average speed in rush hour is Preston at 30 km/h.
Note: Travel time data is based on a sample and may not be representative of all routes or times of day.
Is your commute getting slower?
| City | Average travel time per 10km | Change from 2022 | Average speed during rush hour |
| London | 37 mins 20s | +1min | 14 km/h |
| Manchester | 23 mins 30s | +20s | 21 km/h |
| Liverpool | 22 mins 50s | +30s | 22 km/h |
| Bristol | 22 mins 40s | +10s | 21 km/h |
| Edinburgh | 21 mins 30s | No change | 24 km/h |
| Sheffield | 20 mins 40s | +20s | 24 km/h |
| Leicester | 20 mins | +30s | 25 km/h |
| Nottingham | 19 mins 50s | +10s | 25 km/h |
| Cardiff | 18 mins 40s | +20s | 28 km/h |
| Bournemouth | 18 mins 30s | +20s | 27 km/h |
